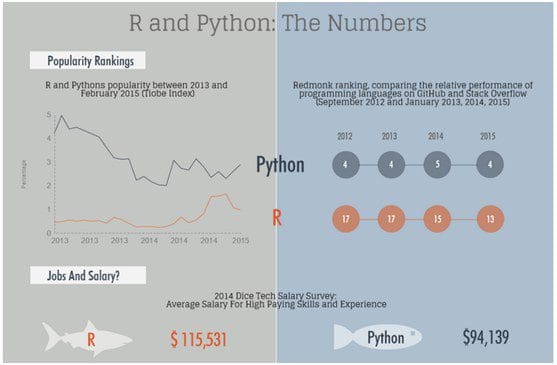
What is R?
R is a programming language and software environment for statistical computing and graphics supported by the R Foundation for Statistical Computing. The R language is widely used among statisticians and data miners for developing statistical software and data analysis. Polls, surveys of data miners, and studies of scholarly literature databases show that R's popularity has increased substantially in recent years.
-- Wikipedia
Why should I care about R?
- easy to learn & use
- R is one of the best programming languages for data processing and #1 for statistics
- used at Google, Microsoft and many others
- thousands of well maintained open-source libraries on CRAN
- good support from open-source and enterprise projects (e.g. Spark, Microsoft Azure, Google products, ...)
- goes well with other languages - use R for visual output and prototyping, rewrite parts when you need performance to C

Disadvantages of R
- not ideal for all purposes
- invented by a statistician, some language features feels weird to programmers
- could be slow if used inappropriately (avoid
forloops at all cost!)
Alternatives to R for working with data
Python
The only serious "competitor" to R. Python libraries for data analysis like pandas were heavily inspired by R.
SAS, Statistica
Very expensive enterprise solution. Their intuitive "drag & drop" environment made for non-programmers turns out to be hell for programmers.
Excel
Seriously?
Programming environments for R
- RStudio (will be used at the seminar)
- R console
- Jupyter Notebook
Interesting libraries
- http://shiny.rstudio.com/gallery/kmeans-example.html
- https://github.com/hadley/ggplot2
- machine learning libraries (gbm, cart, ...)
R as a "better" calculator
sqrt((42 + 4.2)^2 + sin(exp(1) * pi))
Variables
a = 1
# operator <- is the same as =
b <- 2
c = a + b
c
Basic data types
# numerical type
a = 2
a = 2.2

# string
a = 'text'

# true / false
a = TRUE
a = FALSE
a = T
a = F

# vectors
a = c(1,2,3)
a = 1:3
Operators
1 == 1
1 != 2
1 < 2
!TRUE
is.na(NaN)
is.null(NULL)
Advanced data types
# matrix
A = matrix(1:9, 3, 3)
A = rbind(c(1,2,3), c(4,5,6), c(7,8,9))
A
# dataframe (= matrix with column names)
df = data.frame(a=c(1,2,3), b=c('a', 'b', 'c'))
head(df)
Operations on vectors
a = c(1,2,3)
b = c(3,4,5)
# addition / multiplication by elements
print(a + b)
print(a * b)
# cross product
print(a %*% b)
Operations with matrices
A = matrix(1, 2, 3)

# element wise multiplication
A * A
# matrix multiplication
A %*% t(A)
Data indexing
a = 1:10
a[4]
A = matrix(1:9, 3, 3)
# element
A[1,3]

# 1. row
A[1,]

# 1. column
A[,1]
A = data.frame(a=c(1,2,3), b=c('a', 'b', 'c'))
# column `a`
A[,'a']
# first row
A[1,]
# columns `a` and `b`
A[,c('a', 'b')]
Basic functions
a = c(1,2,3)
sum(a)
mean(a)
max(a)
min(a)
sd(a)
Graphics
options(repr.plot.width=7, repr.plot.height=5)
x = 1:100
y = sin(0.1 * x)
plot(x, y, xlab='x-label', ylab='y-label', main='Main title')
require(datasets)
pairs(iris[1:4], main="Edgar Anderson's Iris Data", pch=21,
       bg = c("red", "green3", "blue")[unclass(iris$Species)])
Functions
add = function(a, b, c=1){
    return(a + b + c)
}

add(3, 4)
add(3, 4, c=2)
If-else conditions
answer = 42
if(answer == 42){
    print('Correct answer')
} else if(abs(answer - 42) <= 2){
    print('Almost...')
} else {
    print('Wrong answer')
}
Loops
Always vectorize your code if you can! If not, then either implement core parts in C or take a very long cofee break.
vec = 1:10
for(i in vec){
    print(i)
}
i = 0
while (i < 2){
    i = i + 1
    print(i)
}
Loading data
data = read.csv('foo.csv', sep=';', header=TRUE)
head(data)
External libraries / scripts
# install library from CRAN
install.packages('circular')

# load library into current namespace
library(circular)

# execute code from file (load external functions)
source('my-functions.R')
Function apply
Function apply applies given function to all rows / columns of a matrix (or data.frame).
# column mean
apply(data[,c('id', 'age')], 2, mean)
# row mean
apply(data[,c('id', 'age')], 1, mean)
Other functions
# better print with string concatenation
cat('Print', 'text', 42, '\n', 'to next line')
# string concatenation
print(paste('Text', 'with', 'spaces'))
print(paste0('Text', 'without', 'spaces'))
